Increase Utilization Across Equipment Types

Since the ISO telematics standard was released nearly a decade ago, super work has been done to resolve many of the differences between manufacturers and develop the standards needed to build integrated platforms for fleets that contain several different brands.
But that solved only part of the problem.
Many of the solutions assume that fleets only run loaders, dozers, and trucks. That is not true, however. They run a huge variety of cars, pickup trucks, tools, attachments, and all sorts of different equipment that is used on different sites in different ways. Solving the problems associated with a “mixed fleet” is not limited to solving the problems associated with different brands: Fleets need to have data and systems that enable it to manage buckets, attachments, variable message boards, and water pumps as well as loaders, dozers, and trucks. A skid steer is not managed in the same way as a 600-horsepower crawler dozer. Management does not use the same data, does not do the same analytics, and above all, does not have the same expectations when it comes to utilization, reliability, age, and other critical metrics.
How to manage a mixed fleet
The first step is to divide and conquer. Recognize that the fleet is made up of different groups and manage each group with the skill, care, and attention it deserves. One size does not fit all, and it is impossible to adopt a single standardized approach that suits every unit in the fleet.
Let’s look at and understand the variety of equipment groups given in the diagram below, then think about how to measure the utilization and determine the job charges to be paid by end users of the assets in each group.
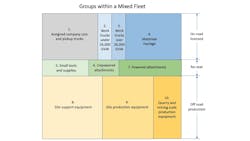
The top row in the diagram shows four groups of on-road, licensed vehicles. They will vary from assigned personal cars to belly dumps used to haul material to construction projects. The assigned cars and trucks are easy. Each vehicle has an assigned driver; each vehicle will have a card for fuel, maintenance, and running repairs. We simply review the statement from the card company at the end of the month, pay it, and seek reimbursement from the driver’s cost center. Utilization is a little more complex. Do we assume that every vehicle is used every day and accept that, in the end, it is the total ownership period and mileage that count, or do we insist on driver logs?
The next group of on-road vehicles includes the small and larger crew trucks, mechanics trucks, and lube trucks. Do we assume that the truck is utilized for the time recorded by the crew or technician using it and use payroll data to measure utilization and charge the appropriate cost center? Or do we use one of the many competent systems for tracking and tracing location and mileage and base everything on the telematics feeds that come from the trucks?
More on asset management
- Understand the strengths and weaknesses of cost-tracking systems
- Inflation strains equipment budgets
- Sargent uses data for regional fleet maintenance
- 2025 construction equipment fleet outlook
The on-road materials haulage fleet comes next in the diagram. Here we find the tri-axle trucks, belly dumps, and side dumps. Again, there are competent, well-established systems for managing an on-road trucking fleet, recording load tickets, and complying with ELD mandates. Do we measure utilization by the day or the mile? Do we charge by the ton, day, or mile? How do we handle the owner-operator trucks we hire daily? How do we handle all the idling time spent in traffic, at the crusher, or at the paver? It is not simple, and we probably need a specialized system to manage this frequently large and costly part of our business.
The second row in the diagram has its own set of problems. This is where we will find categories that are small enough to give us a big headache. It is unlikely that any of the units will have seats and assigned operators. Some will be powered, and some will not; all will give huge problems when it comes to tracking, tracing, measuring utilization, and managing inventory.
Small tools and supplies are at the left-hand end of the row. Many companies see this as a job cost with a casual approach of buy it, use it, forget it. Others ask crews to manage and maintain tool trailers stocked with everything they need. Others recognize the substantial costs involved and use bar codes, RFID tags, and specialized tool tracking software to look after pumps, generators, quickie saws, chain saws, and hand tools.
How to track attachment usage
We move from there to the unpowered and powered attachments needed for everything from a 70-horsepower skid steer to a 400-horsepower excavator. It is no good having an attachment if you do not know where it is and who to charge. Tracking and tracing is again a big issue. Low-power asset tracking devices with defined geofences are becoming standard, but again you need a specialized system for a specialized task. Costs can be substantial and large powered attachments such as hydraulic hammers and trench saws are frequently seen as individually identified assets with their own serial numbers.
The big-ticket, off-road production items lie in the third row. Again, there are complexities. They are not all the same size, they do not all work on high-production applications, and each has different demands when it comes to collecting the data needed to measure utilization.
At the left hand side of the row is the fastest-growing segment of many fleets: mini excavators, compact track loaders, and skid steers. Do we measure utilization by the hour, or do we treat them much like crew trucks and use payroll data to measure utilization and bill the appropriate cost center? Do we use telematics, position data, and geofences to charge them to jobs by the day; or do we charge by the hour like we do for the larger units.
The middle of the bottom row—site production equipment—is probably the largest part from an investment point of view. Many competent computerized maintenance management systems (CMMS) are available, and this is where the work done to standardize telematics data across different brands has had good results.
The jury is, however, still out when it comes to as simple and basic a thing as recording hours worked. Do we move to self-reporting machines and use telematics and geofence data to measure utilization and produce job charges? If we use telematics and self-reporting machines, how do we measure hours worked: from key on to key off, or do we deduct every minute that the engine is below operating rpm? Or do we stay with manual methods and use more standard technologies to record and transmit field data? Do we do both and reconcile one against the other to improve the quality of our data?
The answer probably comes from the fact that site production equipment frequently works on more than one job cost phase code during a given day. Telematics data cannot tell you whether your 400-horsepower excavator is loading in a cut or excavating a trench. Only operators and supervisors can identify whether a truck is hauling to spoil or hauling to fill. Telematics and sensor-based technologies have a ways to go before we can think about eliminating the need for a foreman or supervisor to fill in the DJCR (daily job cost report) that details resources used, work done, and a host of other details critical to the administration of a construction contract. For now, it appears that we must not transition entirely to self-reporting machines.
Using hours worked to measure utilization raises the interesting question of stand-by time and the number of hours per day that needs to be worked to recover the fixed costs of ownership. There are three solutions. Record and use only hours worked and consider that machines cost nothing when they are not working. Charge jobs a minimum number of hours for each day the machine is on site, and force supervisors to allocate hours to job cost phase codes regardless of whether the machine was used for the given period or not. Develop a dual-rate system that keeps job costs true and allocates the ownership costs associated with stand-by equipment to a distinct job cost code.
The last part of the bottom row covers mining and quarry production machines that stay at one location for most of their life and where the one location experiences the full lifecycle cost. Competent planning of a relatively static situation will ensure utilization, and it is seldom necessary to have complex internal charges for machines in this group. Costs are collected and recorded at a unit level, and actual costs are charged to the operating entity monthly. Lifecycle cost and, particularly, lifecycle cost per ton are the critical metrics; there is little need to track and trace units that work in a relatively static environment.
Construction fleets are complex, with many different machines and equipment. No standard solution tracks, traces, and measures the utilization of every asset. We must recognize the complexities of each group present in the fleet, define their management needs, and develop solutions tailored to the demands of each group. There is probably no single solution available. Wouldn’t it be nice if there was.
About the Author

Mike Vorster
Mike Vorster is the David H. Burrows Professor Emeritus of Construction Engineering at Virginia Tech and is the author of “Construction Equipment Economics,” a handbook on the management of construction equipment fleets. Mike serves as a consultant in the area of fleet management and organizational development, and his column has been recognized for editorial excellence by the American Society of Business Publication Editors.
Read Mike’s asset management articles.