Don’t Let Your Fleet Enter the Spiral of Doom: Understand Construction Equipment CAPEX Budgets
Key takeaways:
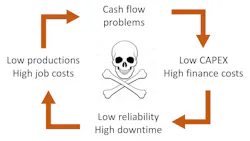
- Underfunding CAPEX creates a downward spiral. Delaying equipment replacement increases repair costs, reduces reliability, hurts productivity, and further limits cash flow.
- Track fleet age, not just fleet costs. Managing the balance of young, mid-life, and older machines helps control operating costs and maintain uptime.
- Steady equipment replacement beats boom-and-bust spending. Consistent CAPEX investment keeps fleets productive, reliable, and out of the "Spiral of Doom." Believe us, you don't want that.
Many years ago, I walked round the yard of a heavy grading company that had recently gone out of business to see if there was anything of interest coming up at the auction scheduled for the next day. Not surprisingly, there was nothing. A lot of old iron that had worked well beyond its sweet spot.
I knew the equipment manager, and we shared a cup of coffee. “Tell me, Jim,” I asked, “how did this all come to pass?”
“Well,” he said, “There were a couple of big jobs we underbid three or four years back and cash became very scarce. We then had another bad job last year. We were having trouble completing work on time, the owners no longer wanted to be in construction, and we had no option but to close the business down.”
Why construction equipment CAPEX budgets matter
It is a sad but not unfamiliar story. I suspected that the seeds were sown in the “big jobs that were underbid three or four years back,” and so I asked Jim when last he had a decent CAPEX budget to replace machines as they became progressively older and less reliable. His reply was simple, “I have not had a decent CAPEX budget for the last four years.”
It is a sad story. It does, however, clearly tell us how important it is to manage fleet average age and continue to invest in your fleet. You absolutely must not get caught in the “Spiral of Doom” — low cash flow, low CAPEX, low reliability, lower production, and even lower cash flow. It is easy to say that you must keep investing in your fleet, but it is extremely difficult to define how much and when. Many companies set CAPEX budgets (capital expenditures) as a percent of contract revenue, as a percent of free cash flow, or as a percent of depreciation earned. All the metrics have value, and all strive to set benchmark values.
How fleet age drives equipment costs and reliability
We all know that owning costs — depreciation, loans, and leases — are high in a young machine and that operating costs — especially repair parts and labor — are high in an old machine. The same would be true for your fleet. So, why not look at the ratio of repair parts and labor to total fleet costs as an indicator of an aging fleet? The logic is sound, and it works. Many companies are using this metric to determine how much CAPEX is required to stop you from spending extraordinary amounts on parts and labor to keep an old fleet reliable and productive. But what about trying to measure the relationship between CAPEX and the age, quality, and productivity of the machines in your fleet and that you use every day to build work safely, on time, and on budget? What can we do? Are there any metrics we can use?
Managing fleet demographics and equipment replacement
We are, in many ways, talking about the “demographics” of the fleet. How many young, middle aged, and old units have you got in the population? Which are contributing and which are costing more than they contribute? The new units currently in the fleet will, in the next few years, stop being expensive youngsters with high depreciation and finance costs and move towards their “sweet spot” or optimum cost period before transitioning into old age when expenditure on parts and labor grows and reliability falls. So, as with all of us, we can imagine three periods in the life of a machine — a young, early period when finance costs predominate, a middle-aged optimum cost and performance period and an older “wear-out” period when costs go up, reliability goes, down and it is time to retire the unit.
As with all of us, units transition naturally through these three periods. All things being equal, the young machines you have now will one day move into their “sweet spot,” and from there they will one day move into their high cost, low reliability retirement zone. The question is: How much do you invest in your fleet so that you can add the young machines required to replace worn-out old units? And how do you grow that business without impacting your ability to complete the work on schedule and meet tight bid budgets?
The key words are at the end of the sentence. We must complete the work safely, on schedule, and on budget. We are contractors. Schedule and budget come first. We will hold on to old machines if this is what is necessary to get the work done. This is what happened to the company that Jim worked for — they had no option but to build the work. They were not buying new machines, so they had to keep and continue to use old, unreliable and costly units. They had no option but to go round the Spiral of Doom.
What can we do about it?
Let’s look at the diagram below.
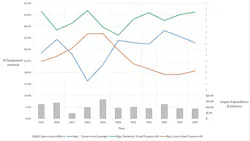
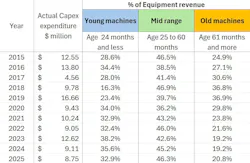
The horizontal axis is in years and covers the period 2015 to 2025. The three lines, plotted on the left axis, show the percentage of the total equipment revenue (total job charges) flowing into the equipment account that was earned by each of the three “population groups.” These, in this case, are defined as:
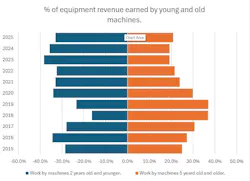
- Blue percentage earned by machines two years old and younger.
- Green percentage earned by machines between two years and five years old.
- Orange percentage earned by machines more than five years old.
The bars show the annual CAPEX expenditure plotted on the right axis. The values used to plot the lines and bars are based on actual company data. Values have been adjusted for confidentiality, but the trends and patterns shown are similar to those seen in practice. It looks like things were not good in the years 2017 and 2018. CAPEX was dangerously low, new machines were not brought in to help get the work done, and so the old machines were kept in the fleet and kept on the job. The orange line went up dramatically — work was done — but at what cost in parts and labor, poor job performance, and downtime? The low investment in 2017 impacts the graph very quickly, but the situation clearly improves in 2019. CAPEX is high.
Young machines come into the fleet and support activity to the extent that work done by the “middle-aged” and the “old” groups is reduced. The lines stabilize from 2020 onwards. Young machines “graduate” to the middle-aged group which now contributes between 40 and 45 percent of the revenue. New machines are constantly being brought in, and this makes it possible for the older group to be aged out and retired without impacting the company’s ability to get the job done.
The lesson: Avoid the fleet Spiral of Doom
I will wager that operating costs go down and reliability improves. It seems like a CAPEX budget of round about $20 million per year keeps things stable. The diagram shows exactly what happened to my friend Jim. The CAPEX bars went to zero, the blue line followed shortly thereafter. Middle-aged machines became old machines; the orange line went up to 100 percent. The company ended up trying to do all its work with old machines. Schedule and cost performance deteriorated. The company went round the Spiral of Doom. The end was inevitable.
We have looked at a slightly different approach to fleet age planning. We have imagined the fleet as a population that ages naturally. We have emphasized the fact that we must get the work done and that we will use the equipment in the fleet to achieve the required results. We have shown that this will become increasingly difficult and costly if we do not ensure a steady flow of young machines into our population. We know that the Spiral of Doom awaits companies that do not continuously invest in their fleet. It is, in fact, exactly the same thing that happens to companies that do not continuously invest in their people.
I would like to acknowledge inspiration and guidance from good friends in preparing this article. We think creatively, and so we move the needle.
Related reading: Are your machines actually earning their keep?
A healthy CAPEX budget gets the right machines into your fleet. But simply owning newer equipment doesn't guarantee profitability. Those machines still need to be in the right place, at the right time, and working enough hours to recover their ownership costs.
In Deployment vs. Utilization: Let's Compare the Two Numbers That Drive Equipment Profitability, Mike Vorster explains why deployment is the foundation of utilization and how measuring both metrics helps fleet managers identify idle equipment, improve dispatch decisions, and maximize return on every machine. You'll also learn how deployment and utilization work together to recover fixed owning costs and improve fleet performance.
Read next: How to Measure Equipment Deployment and Utilization in Construction Fleets
About the Author

Mike Vorster
Mike Vorster is the David H. Burrows Professor Emeritus of Construction Engineering at Virginia Tech and is the author of “Construction Equipment Economics,” a handbook on the management of construction equipment fleets. Mike serves as a consultant in the area of fleet management and organizational development, and his column has been recognized for editorial excellence by the American Society of Business Publication Editors.
Read Mike’s asset management articles.