What a year it has been for water. From the Flint, Mich., water crisis spewing headlines in the first quarter, to ensuing reports of lead-ridden drinking water elsewhere, water safety—or lack thereof—found an unprecedented spotlight in 2016.
Keeping the water crisis in mind, state legislatures reviewed their drinking water regulations in 2016. Several states were successful in passing legislation requiring assistance for short- and long-term infrastructure needs and funding to provide lead tests, according to the Water Quality Association (WQA). A few highlights include:
- Michigan: A $28 million appropriation includes measures to provide both immediate, short-term relief, as well as long-term solutions.
- Ohio: Senate Bill 512 requires the Ohio EPA to adopt rules addressing lead and copper notification and testing for community and nontransient noncommunity public water systems.
- Illinois: House Joint Resolution 153 requires the Illinois EPA and Department of Health to complete a final report on lead in the state’s drinking water by Jan. 1, 2017.
- New Jersey: More than 12 pieces of water-quality legislation, including Senate Bill 2062 that gave $20 million to the New Jersey Department of Environmental Protection for remediation of elevated drinking water lead levels in public buildings. Assembly Concurrent Resolution 161 created a joint legislative taskforce to make recommendations concerning drinking water infrastructure in the state.
- Arizona: Public water systems must identify and provide notice to residents possibly affected by lead contamination of their drinking water.
CONSTRUCTION SECTOR REPORTS
Thanks in part to Flint, U.S. infrastructure needs have spurred legislation in Congress. In the fall of 2016, the House and Senate passed versions of the Water Resources Control Act (WRDA).
The Senate version, according to the WQA, integrates provisions from other proposed drinking water bills, and provides $4.5 billion for U.S. Army Corps of Engineers water resource projects and $4.8 billion for drinking water and clean water infrastructure. It also provides $220 million in aid to communities suffering from public health emergencies.
The House Committee on Transportation and Infrastructure version focuses on Army Corps of Engineers projects and authorizes $170 million for infrastructure improvements in communities with public health emergencies.
Congress must reconcile the different WRDA bill provisions.
Another stroke of positivity for Flint happened on June 23, when the U.S. EPA, in coordination with the U.S. Centers for Disease Control, completed testing of water filters in Flint and found that the filters distributed by the state of Michigan effectively remove lead or reduce it to levels well below the EPA’s action level of 15 parts per billion. This undoubtedly brought comfort to the people of Flint.
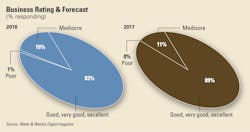
As for the professionals who buy and specify equipment, they are feeling on the upswing going into 2017, according to Water & Wastes Digest’s 2016 State of the Industry report.
Although 2015 saw 32 percent of respondents’ revenues increase, 2016 yielded 34 percent of respondents with the same good fortune. The portion of respondents who claimed a revenue decrease between 2015 and 2016 is down to just 13 percent of respondents vs. last year’s 19 percent.
There is more confidence in next year panning out to be a good year than was noted in last year’s survey: In 2015, 13 percent of respondents thought their revenue would decrease in 2016; but in this year’s survey, just under 5 percent of respondents predicted a revenue decrease in 2017.
Similarly, the number of respondents reporting a “good” or “very good” overall firm health rose between 2015 and 2016, with 75 percent claiming “good” to “very good” overall firm health, compared with 69 percent who claimed the same thing in 2015.
Twenty-six percent of respondents are planning construction of new water/wastewater facilities within the next 24 months. An additional 8 percent have new construction plans within 36 months. Forty-one percent are planning to upgrade their facilities. This number is down from last year’s 55 percent.
The largest percentage of respondents’ budgets will be invested in pipe/distribution over the next 24 months. This will account for 16 percent of budget expenditure. Sewer/collection and pumping equipment are the next-highest expenditures, with 12 percent of budget allocated for each over the next 24 months.
More than two-thirds (69 percent) of survey respondents are involved with determining needs, 48 percent evaluate brands, 59 percent specify products and vendors, and 43 percent have authorizing and approval responsibility. Overall, 84 percent of respondents are involved in the buying process.
Speaking of buys, the Water and Wastewater Equipment Manufacturers Association (WWEMA) and Boenning & Scattergood recently released its 2016 3Q WWEMA/Boenning Leading Demand Index, formulated to provide insight into near-term market and funding conditions related to municipal water and wastewater projects. The Index increased slightly in the third quarter reversing the recent downward trend and suggesting an improving outlook for water and wastewater infrastructure products in 2017. According to the report’s author, Boenning & Scattergood managing director Ryan Connors, this indicates that the outlook for the sector appears to be improving.
The Index indicates that “water and wastewater utilities are continuing to expand their payrolls, water and wastewater equipment demand improved notably in recent months, water stocks rebounded sharply in the third quarter, ductile iron pipe prices reversed their second quarter slide, and the housing market remains a wild card that could complicate the recovery.”
--Elisabeth Lisican is editor in chief of Water & Wastes Digest
