Understanding the Cost of Capital
Key Highlights
In this article, you will learn:
- A definition of cost of capital.
- Methods for calculating the average capital tied up in a fleet.
- How to include the cost of capital in equipment rates.
- Three valuation methods and how they impact the perceived cost of capital.

Owning and operating heavy equipment comes with familiar expenses: fuel, insurance, tires, filters, repairs. Beneath those obvious costs lies another that is far less visible and often ignored: the cost of capital.
Few topics in equipment management create more confusion than how to account for the return on the money tied up in equipment. Some companies exclude the cost of capital from their internal rate, others insist on including it, and many are unsure what it represents, why it matters, or how to calculate it. The simple truth is, every dollar tied up in a piece of iron is a dollar that cannot earn a return anywhere else.
A $750,000 articulated truck is no different than a $750,000 stock portfolio: Both tie up capital, both carry risk, and both must generate a return on investment. When that return is ignored, the economics of stock or equipment ownership no longer make sense.
Many contractors assume the return on capital is recovered through project margins—the output or work the equipment is used to produce. Others, including rental companies and finance professionals, view equipment as a stand-alone investment that must earn its own return, regardless of job performance. Rental fleets operate entirely on this principle. The rental rate must cover all costs including a return on capital. Remove the return, and the model collapses.
Construction fleets operate under the same economic reality, even if production activity hides the numbers. The question to be answered: Is the cost of capital a real cost? If it is, how is it calculated?
Understand the cost of capital

The cost of capital is often confused with interest, loans, and lines of credit, but it represents something simpler: the return the money tied up in equipment could have earned if invested elsewhere.
This is true regardless of how the equipment was purchased.
- Cash purchase: the money used is no longer available for other investments.
- Debt purchase: interest payments represent a real cost of obtaining capital.
- Mixed financing: both debt and equity come with an expected return or cost.
Even when a machine is fully paid off, the capital inside it does not become available. It remains locked in the iron as equity until the equipment is sold or refinanced.
For rate setting, what matters is not the funding method, but the fact that the fleet represents a significant commitment of capital; and that capital comes with a cost for as long as the machine is owned. Whether the return comes from project margins or from the fleet as an investment of its own, the conclusion is the same: The cost of capital is real, it begins the day the equipment is purchased, and it belongs in the ownership rate alongside depreciation, insurance, and licenses.
How to determine the cost of capital
Calculating the cost of capital requires two things: determining what interest rate should be used and calculating how much capital is tied up by the machine over its life.
The interest rate used should reflect the availability and cost of capital, either the return the company expects on its own funds or the cost of borrowing those funds.
In practice, companies that self-finance or have more equity invested often choose a rate that mirrors the return their capital is expected to earn elsewhere. That return becomes the benchmark for equipment investment. Companies that rely more on financing usually select a rate close to their borrowing cost, since this reflects the true cost of accessing capital.
Both approaches are valid foundations for cost-of-capital calculations.
The second question—how much capital is invested in the machine over its life—is where methods differ. Three common approaches are used across the industry:
- Simple Average Value (SAV) is practical and widely used.
- Annual Average Value (AAV) is more accurate and finance-aligned.
- Market Average Value (MAV) is based on accelerated market depreciation.
Each produces a different capital pattern and, as a result, a different capital value.
Comparing approaches to capital
To compare the methods, consider a 40-ton articulated truck with a purchase price (PP) of $750,000; expected life (N) of 10 years; residual market value (RMV) of $75,000 (10% of PP); and a cost of capital of 3.5%.
The SAV method
The SAV method is practical, straightforward, and contractor-friendly. It assumes a straight-line change in value over the machine’s life to calculate the average capital tied up:
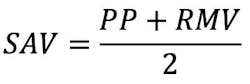
For the articulated truck example, this produces an average capital base of $412,500. At a 3.5% cost of capital:
- Annual cost of capital is $14,437.50
- Cost of capital per hour is $9.63 (at 1,500 hours/year)
The AAV method
The AAV method is more accurate and aligned with financial exposure. It aligns more closely with how accountants and lenders assess assets: by emphasizing the value at the start of each year rather than the midpoint.
This approach recognizes that the greatest amount of capital is at risk during the early years of ownership, when the machine carries its highest value. In essence, AAV considers the time value of money and the higher financial exposure that exists when the equipment is new and most capital is tied up.
The AAV formula is:
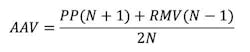
For the articulated truck example, this yields an average capital value of $446,250.
At a 3.5% cost of capital:
- Annual cost of capital is $15,618.75
- Cost of capital per hour is $10.41
AAV produces a higher and more realistic capital cost than SAV because it weights the early, high-value years more heavily. It is a strong choice for financial modelling, lifecycle analysis, and long-term fleet planning.
The MAV method
The MAV method is useful for taxes yet risky for internal equipment rates.
Market-based approaches require knowing the market value for each year, closely mirroring a double-declining balance (DDB) depreciation curve where the capital value drops quickly in the early years as book value is driven toward salvage.
Using a market value curve over 10 years, the average capital value is significantly less at $245,265.
- Annual cost of capital is $8,584.28 on average
- Cost of capital per hour is $5.72 on average
The lower dollar value looks attractive for rate setting, but it comes with a catch: The capital base shrinks so quickly that the cost of capital is applied to a much smaller value for most of the machine’s life. Over the full life of the articulated truck, MAV understates total cost of capital by roughly 40% to 45% compared with SAV or AAV.
Think of it this way. Had the equipment been financed, interest is charged on the purchase price, not on a declining market value. Why should the cost of capital be calculated any differently?
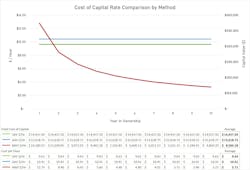
A powerful way to illustrate this is a year-over-year graphic that plots the hourly cost of capital. In Year 1, the rate is high; by Year 10, it has fallen to only a few dollars per hour. The visual makes it clear how accelerated depreciation drives down the capital base and, with it, the recovered cost of capital.
MAV reflects how the market perceives value, not how much capital is actually tied up. It is useful for tax planning and financial reporting, but it is a poor choice for internal equipment rate recovery and adds unnecessary complexity and risk to repair-versus-replace decisions.
How methods compare
Using the 40-ton truck example, the three methods produce the following results:
Money invested in equipment ties up capital, and capital is never free. The cost of capital is real, measurable, and central to understanding the economics of equipment ownership. Capital tied up in equipment must generate a return, and the internal equipment rates need to recover that cost in a consistent and defensible way. Ignoring it does not make owning equipment cheaper, it simply hides the cost and shifts the financial burden elsewhere in the company. The equipment rate must reflect that reality.
About the Author

Craig Gramlich
Craig has extensive experience in equipment management across transportation, heavy lifting, civil projects, mining, and construction sectors. Driven by a passion for cost and data analysis, he excels in enhancing equipment accounting, rate modeling, and developing programs for rate escalation and transfer pricing.
Through Lonewolf Consulting, Craig effectively unites Equipment, Operations, and Accounting departments, leveraging his extensive field experience to help companies streamline operations and find cost savings, significantly boosting ROI.
He holds a Bachelor of Commerce from the University of Alberta and a Certified Equipment Manager (CEM) certification, along with a variety of professional development courses, showcasing his commitment to ongoing professional growth.