Key Highlights
In this article, you will learn:
- How to establish clear lifecycle assumptions to plan replacements and manage costs.
- How to differentiate between useful life and economic life.
- How to use data to refine target life estimates.
- How to calculate the average cost per hour at target life.
- How to implement a structured lifecycle framework.
As fleets grow, managing machine age and planning replacements can become complicated—but it doesn’t have to. With a simple framework, you can bring order to the chaos, improve capital expenditure plans, make smarter repair-or-replace decisions, and ground the internal rates with clear assumptions.
Every machine has an economic life. This is not to be confused with useful life, which is the age accountants use for calculating depreciation for financial reporting or tax purposes. Economic life is the period when owning and operating costs per hour are at their lowest. Once that point is reached, keeping the machine no longer makes economic sense.
Economic life is an estimate. When applied to fleet management, it becomes a “target life.” The goal of setting a target life is simple: to know the right time to replace a machine and not wait for breakdowns to force an expensive decision.
Set clear lifecycle assumptions for equipment
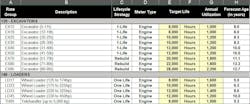
The best way to manage fleet age around this concept is to set clear lifecycle assumptions. Start by building a spreadsheet or table to help organize key decisions by equipment group. Below is an example for excavators and wheel loaders.
Columns A and B identify the functional group and size class of each machine, creating a clear structure to work from. This example follows the asset structure outlined in Six Steps To Create an Asset Structure. Once the structure is in place, work through four key decisions to complete the table and define the lifecycle plan.
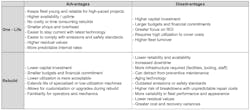
Column C denotes the lifecycle strategy for each category of equipment. There are two main options. One Life means we keep the machine until a planned age or meter reading—typically just before its first major repair or rebuild—then dispose of it. Rebuild means we plan to replace major components and extend the machine’s life.
This decision comes with trade-offs, outlined in the table below.
Ultimately, holding machines too long can lead to rising costs that may never be recovered, and disposing of them too early can result in unrealized return on investment.
Columns D and F identify the component and unit of measure used to track machine life. For most construction equipment, this will be the engine, tracked in meter hours. For trucks or on-road machines, it may be distance tracked on the odometer.
If some machines require tracking key components separately, such as drills or powerpacks, break them into parent/child or subgroups so the life of each can be monitored properly.
In Column E, set the number of hours, distance, or years a machine is expected to stay in the fleet.
Some fleet managers pick a target based on gut feel, and others analyze data to calculate the economic life. This is also known as the sweet spot, the point where the total cost per hour is at its lowest (see The Sweet Spot Revisited).
Target lives will vary between companies and industries, depending on how machines are used and maintained. A well-maintained machine in light-duty applications can last much longer than one working hard in harsh environments.
Even if the exact sweet spot isn’t known (it is an estimate after all), the most important thing a fleet manager must do is to pick a number. Without a clear target, it’s impossible to accurately plan capital for replacements, develop accurate internal rates, or make smart repair-or-replace decisions.
As the fleet matures, these targets can be refined using real-world data such as cost history, condition assessments, oil samples, or undercarriage reports. This helps adjust the target lives up or down for each category and guides better decisions on individual machines.
Column G contains a prediction about how much each category of equipment is expected to work each year. This estimate must come from operations, but fleet managers can help by providing a three- to five-year history of usage by class and machine.
Setting utilization is about looking ahead—like watching the road through the windshield, not just checking the rearview mirror. History helps spot major changes, but the focus should stay on how much the machines are expected to work in the future.
Column H is calculated by taking the target life from Column E and dividing it by the annual utilization from Column G. This value (in years) gives the forecast age of a machine when it reaches its target life.
This value is quite useful for comparing to the average fleet age. Large gaps may suggest it’s time to adjust replacement timing, purchase decisions (new vs. used), or rate assumptions.
How to plan for machine lifecycles: A case study
A 450-size excavator has 11,000 hours on the meter and needs an undercarriage replacement estimated at $120,000. The target life of the machine is 12,000 hours, and the internal rate is $160/hour, which includes a provision of $14.75/hour for undercarriage. So far, the life-to-date owning and operating cost has averaged $155/hour.
Should this machine be repaired or retired? Let’s do the math:
1) Current life to date (LTD) owning & operating costs are $1,705,000 (11,000 hours x $155/hour). Add $120,000 for the new undercarriage, and the total becomes $1,825,000.
2) Average cost per hour after undercarriage replacement is $165.91 per hour ($1,825,000 ÷ 11,000). Even before you work another hour, your average hourly cost jumps to $165.91, which is above your $160 per hour internal rate. That rate is calculated on a target life of 12,000 hours, however, and there are another 1,000 hours of planned life and costs to consider.
3) The new estimated average cost per hour at target life is now $164.19. We added 1,000 hours of estimated owning & operating costs, subtracting the undercarriage provision ($160 - $14.75), which gives us $145,250 ($145.25 x 1,000 hours). Adding this to the current total cost brings us to $1,970,250 ($1,825,000 + $145,250) and gives us a new average cost per hour of $164.19 ($1,970,250 ÷ 12,000).
Even after running to 12,000 hours, the average cost remains above $160/hour. To recover the $120,000 undercarriage investment, this excavator would need to run another 8,136 hours ($120,000 ÷ $14.75)—far beyond its target life with ever-increasing risk of future breakdowns.
The deeper question—how much should be spent on further repairs?—depends on whether the company wants to maximize its return on investment or simply keep the machine working as long as its costs stay below $160/hour. In this example, the excavator’s LTD cost is $155/hour, already delivering an extra return of $55,000 over 11,000 hours.
Quick math shows about $205,000 is available to cover remaining ownership and operating costs to break even at $160/hour by 12,000 hours:
- Over-recovery to date: ($160 - $155) x 11,000 hours = $55,000
- Future recovery available: $160 x 1,000 hours = $160,000
- Total available: $55,000 + $160,000 = $205,000
It’s also important to check whether the machine’s recent hourly costs are trending above or below $160/hour. This indicates whether LTD costs will rise or fall over the next 1,000 hours.
That surplus, the over-recovery of $55,000, makes a strong case for early retirement now, locking in the return, freeing up capital and shop time, and avoiding rising costs. This assumes that a replacement is planned and available; if not, the unit could be assessed to determine whether a smaller investment would get it to the 12,000 hour target life.
With clear lifecycle assumptions, it’s easier to plan capital expenditures, guide repair-or-replace decisions, and set accurate internal rates. Setting a target life gives decision-makers the clarity to time replacements, manage maintenance, and avoid costly repairs near the end of a machine’s useful life.
This approach strikes the right balance between performance, cost, and timing—helping retire equipment when it makes economic sense, keeping costs predictable, and ensuring each machine delivers value for as long as it makes financial sense—and no longer.
About the Author

Craig Gramlich
Craig has extensive experience in equipment management across transportation, heavy lifting, civil projects, mining, and construction sectors. Driven by a passion for cost and data analysis, he excels in enhancing equipment accounting, rate modeling, and developing programs for rate escalation and transfer pricing.
Through Lonewolf Consulting, Craig effectively unites Equipment, Operations, and Accounting departments, leveraging his extensive field experience to help companies streamline operations and find cost savings, significantly boosting ROI.
He holds a Bachelor of Commerce from the University of Alberta and a Certified Equipment Manager (CEM) certification, along with a variety of professional development courses, showcasing his commitment to ongoing professional growth.


