Toward More Accurate Owning Costs
Managers often take owning costs for granted. Most costs are largely fixed upon closing the deal, and it seems relatively easy to estimate the monthly owning costs likely throughout the anticipated life of a machine. There appear to be few uncertainties in the calculation, and the major risk is, without doubt, utilization: the number of hours you expect to work in a month and have available to recover the fixed costs of ownership.
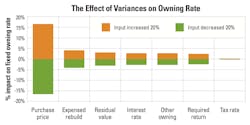
Above: By varying the financial inputs, their effects on the owning rate are seen. The orange bars show the change with an increase of 20 percent, and the green bars for a decrease of 20 percent.
The monthly owning cost calculation is relatively easy if you assume that the machine will be purchased for cash and that neither the tax implications of the decision nor the time value of money (TVM) have any impact on the calculation. The reality of the situation is different, however, and the simplifying assumptions of yesterday are not as valid today. We seldom see pure cash transactions; complex financial deals involving sophisticated loan and lease agreements are rapidly becoming the norm.
Any form of financing that is more complex than a straight purchase arrangement makes it essential to include the impact of tax and TVM in the owning cost calculation. Cash transactions, loans, and leases affect cash flow and taxable income in profoundly different ways. Calculations done to determine an ownership rate or select between alternative forms of finance must therefore include an estimate of the tax implications associated with the transaction as well as a competent analysis of return on investment.
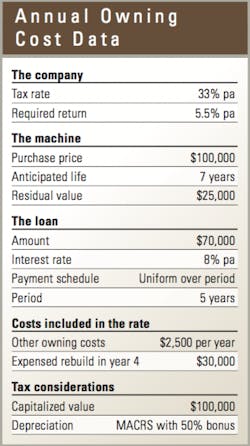
We will base our analysis on the example machine in the table to the right. (There is nothing unusual in the example machine. Your numbers will, of course, vary, but the insights and lessons remain the same.)
The company has an estimated effective tax rate of 33 percent and a required rate of return of 5.5 percent per annum (pa). The machine costs $100,000. It has an anticipated life of seven years, after which it is estimated that it will be sold for $25,000. It is not a cash transaction. The purchase is financed with a $70,000 loan at 8 percent with uniform payments of interest and principal spread over five years. Other than the purchase price, there are two additional payments included in the “dry” owning rate: a provision of $2,500 per year for other owning costs, and a provision for a $30,000 expensed rebuild at the end of Year 4. The capitalized value of the asset for tax purposes is $100,000, and the tax depreciation schedule is the standard MACRS percentages with 50 percent bonus depreciation included.
The annual owning cost, or fixed dry owning rate, produced by the data in the table comes to $22,080 per year. That is our baseline. Now let’s run three scenarios and see what changes.
For our first scenario, eliminate the loan and make it a cash deal. We reduce the amount of the loan to zero. This makes the cash flow in the first year much worse: We ante up $70,000 more right at the beginning. We compensate for that to some extent because we eliminate the lending house’s charge of 8 percent pa as opposed to our required rate of return of only 5.5 percent. In both cases we own the machine, so we can take the full MACRS depreciation with 50 percent bonus depreciation in the taxable income calculation. On the other hand, if we have the $70,000 loan, we can take interest payments as deductions in our taxable income calculation. These are high in the early years, and TMV makes this a big advantage. So, with a cash deal, your cash flow is worse but your cost of money is better. With the loan you have to pay interest, but you are able to take bigger deductions in the taxable income calculation. Net result: almost zero. Your fixed dry owning rate goes to $22,150.
Let’s use our second scenario to see what happens when bonus depreciation goes away in 2020. When this happens, we will most likely return to the standard MACRS percentages of 20 percent, 32 percent, 19.2 percent, 11.5 percent, 11.5 percent, and 5.8 percent tax depreciation in each year of ownership. If you do the numbers, you will see that there is a 1.66 percent change. Your fixed dry owning rate goes from $22,080 to $22,450. Yes, bonus depreciation helps shield some income from tax, but the impact on the owning cost of an individual machine is extremely small.
Let’s envision something different for our third scenario. Let’s assume that our new machine will have high utilization and low repair costs in the first two years of its life, and that the fixed dry owning rate can be 50 percent more than average for the first year and 25 percent more than average for the second year. Let’s assume that availability will be low and repair costs will be high in the later years, and that the fixed dry owning rate can be 75 percent of average in Year 6 and 50 percent of average in Year 7. You are getting your money back earlier and dramatically improving your cash flow. There is an improvement, but not as much as you think. The average rate goes down 3 percent from $22,080 per year to $21,420. That’s not much of an impact, but it is more than enough to cancel out the effect of the loan and the effect of losing bonus depreciation. There is a familiar ring here: You win when you work the machine hard and get your money back quickly.
The bar chart at the top of the page shows the impacts of varying seven of the inputs given in the table by plus or minus 20 percent. The orange bars show the percentage by which the $22,080 benchmark rate goes up as each input is changed by 20 percent, and the green bars show the percentage by which the benchmark rate goes down as each input is changed by 20 percent in the other direction.
The fact that a 20-percent swing in purchase price produces a 17-percent swing in the fixed cost of ownership is not a surprise. It simply reinforces the fact that a good selection and purchase deal lies at the heart of every good equipment management decision. Get it wrong in the beginning, and it is hard work from then on.
A 20-percent swing in the three cost inputs—the expensed rebuild, the residual value, and the other owning costs—causes a combined total swing of less than 10 percent. This is not immaterial, but it is less than one would expect. A 20-percent swing in the three financial inputs, the interest rate on the loan, the required rate of return, and the tax rate produce a combined swing of less than 5 percent. This is surprisingly small.
The fact that purchase price should be known when you ink the deal and that relatively small swings are caused by changes in all the other six inputs combined reinforces the belief that estimating a fixed dry owning rate is not a risky calculation. The number of variables and the way they interact with each other in the calculations of tax and TVM adds complexity but relatively little risk.
The risks and uncertainties associated with the fixed dry owning rate calculation pale into insignificance when compared with the risks and uncertainties associated with three other calculations that must be done before a dry owning rate can be turned into a fully fledged hourly owning and operating rate. First, you need to estimate utilization: the number hours the machine is going to work in a given period. Second, you have to estimate operating cost: how much it is going to cost to turn the key and put the machine to work. Third, you have to estimate economic life: how long you are going to keep it. These are not trivial tasks.
The fixed dry owning rate calculation is about mathematics and science. Utilization, operating cost, and economic life are more about experience and art. But it is important to get the mathematics and the science right. So do the calculation with care.
For more asset management, visit the Construction Equipment Executive Institute.