Annual and Life-to-Date Costs
The difference between annual cost and full life cycle or life to date (LTD) cost is one of the most difficult things to grasp when it comes to understanding equipment costs. This is due to the fact that we have been trained to focus on next year’s cost and next year’s budget, which causes us to take a short-term view of cost. The snag is, you buy a machine for the long term. Although next year’s cost per hour is important, it is not nearly as important as the average cost per hour of owning and operating the machine throughout its full life cycle.
Let’s look at some numbers for an example machine to understand an LTD cost calculation (see table below). We will use a $200,000 purchase price with an expected life of eight years. Row 4 gives the estimated residual market value percentage for the machine at the end of each year, which reflects the percentage of the original purchase price that you expect to obtain if you were to sell it in the open market. In other words, if you were to sell the machine at the end of year 3, you would expect to get 34 percent of the original purchase price. Row 5 is residual market value expected when you multiply the purchase price in row 3 by the values in row 4.
The annual internal depreciation charges billed against a machine play such a big part in any discussion on annual costs that we need to stress that internal depreciation charges are not true costs. They are interim estimates of the loss in value experienced by the machine in a given period and are reconciled by the gain or loss on book value that is only known and calculated when the machine is sold. Reconciling the internal depreciation charges using actual market values rather than book values means that the true cost of depreciation—or loss in value—experienced during the life of the machine is given by the difference between purchase price and residual market value. The true annual cost of depreciation is thus estimated as the difference between the estimated residual market value at the beginning of the year and the estimated residual market value of the machine at the end of the year.
This is calculated in row 6, which shows that the estimated loss in value is the difference between the estimated residual market value at the end of the previous year and the estimated residual market value at the end of current year. It comes to $12,000 in year 5, for example, as the difference between the $52,000 estimated residual market value at the end of year 4 and the $40,000 estimated residual market value at the end of year 5.
Row 7 gives the true cost of keeping the machine and running it in a given year. The cost of keeping it for a year would include the annual cost of licenses, insurance, interest and property taxes for the year. The cost of running it for the year would include the cost of the fuel, maintenance, parts and labor needed to cover the hours worked in the year. Cost increases as repair parts and labor, component replacement and the like increase with age.
Row 8 is the total of rows 6 and 7 and is the total cost for owning and operating the machine for a given year. Row 9 is the annual cost per hour for the given year. These start high in early years when loss in value is high, make a minimum of $22.89 in year 4 and increase in later years when increasing repair and component replacement costs start to dominate.
The annual cost and annual cost per hour shown in rows 8 and 9 are of value in annual budgeting and year to year planning, but they mean little from a life cycle planning point of view. Although we know that the machine will cost $27.78 per hour in year 7, we haven’t answered two key asset-management questions: “How long should I keep the machine, and what will be the minimum average cost per hour for the full optimum life?”
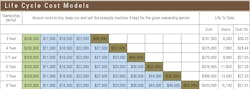
The only way to answer these questions is to create LTD cost models for various ownership periods (see Life Cycle Cost Models at top).
In the three-year ownership model, we use the annual keep-and-run costs from row 7 of the Annual Costs table and the $68,000 residual market value in row 5. The three-year LTD cost would be $181,500, which would “buy” 6,000 hours of work at an average, LTD cost of $30.25 per hour. In the eight-year model, LTD cost would come to $420,000, the LTD hours worked would be 15,100, and the hourly LTD cost per hour would be $27.81 per hour.
The last column of the Cost Models table shows how the LTD cost per hour decreases to a minimum of $27.28 per hour at 11,600 hours and then increases. This minimum cost of $27.28 applies to the full 11,600-hour ownership period. So,
- How long should I keep the machine? 11,600 hours.
- What will the minimum average cost per hour be for the full optimum life? $27.28.
It makes no sense to keep the example machine past the minimum point at 11,600 hours and thereby increase the average LTD costs. Simply put, why spend $50,000 running the machine for 1,800 hours in year 7 and another $53,500 running the machine for 1,700 hours in year 8, causing the average cost of all hours worked to increase from $27.28 per hour to $ 27.81 per hour.
We need to break with our fixation on next year’s cost and next year’s budget and manage our equipment assets as long-term onvestments. Knowing the difference between annual costs and life to date costs enables us to set rates and manage costs over the full economic life. This is the only way to strike a balance between high owning costs in early years and high operating costs in late years and achieve desired results.