Diagnostic tool saves thousands in repairs

A customer reported that his excavator was down on power and his sense was that the issue was likely the hydraulic pumps. He asked for a price to replace them.
“Of course,” I said, “but would you like me to look at it first?”
“No, just give me the price, it needs to be fixed.”
After determining the parts required for the repair, I reported that the cost would be approximately $36,000 for the parts alone.
“Are you sure you don’t want it looked at first,” I asked again.
“Maybe that would be a good idea.”
The customer complaint was that the excavator lost power, and the problem worsened as it warmed up. It also lost a little more than 5 quarts of coolant a day, ran hotter than normal, and had the most trouble in hot weather.
Oscilloscope reveals performance
The most effective tool to determine the problem is the diagnostic oscilloscope. This instrument, combined with a variety of accessories, measures variations in current, voltage, temperature, pressure, and other variables in a vehicle’s components and assemblies. It will then convert those signals into a graphical display called a waveform, which reveals how the system under test is performing over time. Compared to a tool like a voltmeter, this provides a lot more information to work with for virtually the same amount of effort.
Diagnostic oscilloscopes are fast, accurate, and with increasingly intuitive software, easier than ever to use. They can be used to test components individually or to display multiple waveforms from interrelated systems and assemblies to see how they affect one another. A diagnostic oscilloscope can do most of this work in minutes instead of hours, and often without any teardown required.
Whenever I’m working on a machine with lack of power concerns, one of the first things I like to perform is a relative compression test to obtain a quick, overall sense if there are any significant imbalances between engine cylinders. It can also indicate a failing starter motor or poor starter motor cables, as well as provide a cranking speed measurement or overall cranking current. In this case, relative compression results determined that one cylinder was marginally lower, but it was not enough to warrant immediate attention.
The next test measured crankcase pressure using a pressure transducer. This could reveal issues such as blow by caused by sticking piston rings or poor engine breathing due to a crankcase blockage. But this test also displayed a uniform pattern that repeated consistently, so nothing unusual here either.
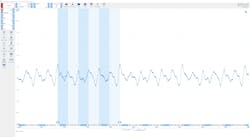
A quick check of exhaust pressures can also be extremely useful to suggest combustion problems since air, fuel, and compression ignition faults all affect the exhaust pressure waveform. Here, instead of seeing uniform, repetitive patterns, I began to see some inconsistencies.
To this point, I had run three separate tests in less than 15 minutes and eliminated potential issues with compression, blow by, and engine breathing. This was all possible thanks to the powerful software that ran my diagnostic oscilloscope and includes a library of guided tests that preconfigured key test setting to save time and eliminate errors. Plus, I now had a sense of where to focus based on the exhaust pulse.
Next, I needed to look at several measurements at once that would give me an overview of the engine during operation and provide information on fueling, crank speed, and cylinder identification. With a few key accessories, one of the scope’s advanced analytic features and components all easily accessible, I gathered the measurements on the screen below that has been annotated post capture.
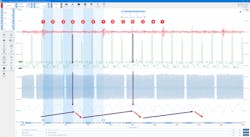
It’s a busy screen, but it was produced from just three signals; a blue crankshaft sensor waveform, a green fuel pressure waveform, and a red waveform that indicated when cylinder one fired. The bottom waveform was produced by a special calculation function that illustrated how the crankshaft sped up and slowed down as the engine rotated.
What these signals showed was that there was a definite crankshaft slow down after cylinder 6 had fired. I knew it was cylinder 6 because the red signal indicated when cylinder 1 fired and I knew the firing order of engine. There was also a repeated pattern at the same time on the green fuel waveform that meant that fuel pressure did not drop as much on cylinder 6 as on other cylinders. Because this lack of pressure drop occurred at the same time as the crank speed slowed down on cylinder 6, I concluded injector 6 did not inject as much fuel as the other injectors, which resulted in poor combustion as well as a momentary loss of power.
In less than an hour, I had gathered enough evidence to give the fuel delivery system closer attention with particular focus on injector 6. And instead of a likely eight-hour, $36,000+ service bill to replace suspect hydraulic pumps—which would not have fixed the issue—the repair would only be expected to take around four hours and potentially save as much as $33,000.
About Pico Technology
To learn more about where to begin with oscilloscope diagnostics for off-highway vehicles, contact [email protected].
About the Author
Ben Martins
A former master technician and recognized oscilloscope user for over 10 years, Ben Martins is an Automotive and Off Highway Application Specialist for Pico Technology. He is actively involved in customer support, training, content creation and the development of new techniques to identify and repair challenging maintenance issues on a wide range of vehicle types and component systems.