Contractors missed their first forecast in years in 2002. Not since 1994 has this group of equipment users been this far off in their expectations. Of course, anyone trying to predict 2002 after the blindsiding hits of terrorism and freefalling tech stocks knew little of what would really happen.
The surprise in 2002, though, was not that contractors missed the mark. No, the surprise was they hit above the mark. The forecast was for an "average" year; contractors reported 2002 as a solidly "good" year. And this group forecasts steady business for 2003, too. All three contractor vocations—highway/heavy, building, and diversified—are forecasting a "good" 2003, highway/heavy on the low end and building contractors the most optimistic.
Publicly funding projects helped contractors last year. In fact, public spending coupled with a strong housing market arguably kept the construction industry going. As privately funded construction fell 1.5 percent in 2002, public spending more than picked up the slack, growing 5 percent above 2001 levels.
Contractors seem to be moving ever so slightly toward that source. Since 1998, the percentage of contractor work volume coming from the public sector has moved from 32.9 percent to 34.5 percent. For the average fleet with more than $5 million replacement value, more than 50 percent of its work is publicly funded.
Sewer and water work led public-project spending in 2002, as highway work slowed a bit. This year, water work and highway spending are projected to lead the way in growth of publicly funded projects. Hard-hit nonresidential work will start to return, and residential will continue strong.
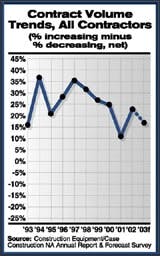
Contractor volume growth was strong in 2002, with the percentage of contractors reporting increases outnumbering those with decreases by 23 percentage points. This net percentage was twice the forecast given at the end of 2001. The strongest region, the Northeast, had 52 percent increasing volume and only 8 percent reporting decreases for a net of 44 percent on the growth side. The most volatile region was the Mid-South, where 43 percent of respondents said they had volume increases and 24 percent reported decreases. The Mid-South's net was a 19 percent increase.
Volume in 2003 is forecast to continue its pattern of strong growth, although the trend is not as strong. About 40 percent forecast increasing volume, and 23 percent see a decrease in 2003 for a net of 17 percent on the growth side.
Fleet sizes—in terms of number of machines—will also grow this year, continuing at the pace of the past couple of years. Last year, 38 percent increased fleet size and 6 percent reduced, for a net of 32 percent. This year, 54 percent say their fleets will stay the same, but a net of 31 percent say fleet size will grow. The larger the fleet, the greater the difference between those growing their fleet and those decreasing.
Although the numbers are down from the peak years of 1998 and 1999, fleet size continues to grow at a rate comparable to the first years after the recession of the early '90s.
The average fleet replacement rate, that is, the number of old machines being replaced, continued to drop from its peak of 12 percent in 1996. Last year, that rate was only 8.8 percent, even though contractors had forecast that they would replace equipment at the same rate they had in 2001—9.4 percent. Perhaps this year will see the replacement rate begin to rebound: The forecast for 2003 is a replacement rate of 9.9 percent.
As contractors replace machines, the preferred method of acquisition—whether employed on new or used machines—is through purchase. Both outright purchase and financed purchase are by far the favored methods, used by 50 percent and 48 percent, respectively. Rental/purchase, lease/purchase and short-term rental are other popular acquisition options contractors use.
Sixty-six percent of contractors say they use short-term rental, defined as a rental period of less than one year, and the amount of use stayed the same in 2002 compared with 2001. Above-average use occurs among fleets larger than $10 million in replacement value, at 82 percent usage, and 74 percent of highway/heavy contractors. Light earthmoving equipment led the list of popular machines rented, followed by light equipment, air compressors and generators, and compaction equipment.
Competition continues to be intense among contractors, especially for those with fleets greater than $1 million in replacement value. Almost 80 percent of those contractors say they face "intense" or "very intense" competition.
They also report intense competition within the equipment market, with 59 percent citing "intense" or "very intense" competition in regards to pricing, model selection and the number of quality brands available.
The trend in company health dropped to 71 percent that report "good" or "very good." This is down from 2001, when 81 percent ranked their company's health as such. Among the largest fleets, however, 89 percent reported their company is in "good" or "very good" health.
Fleet health has also diminished since 2001, with 42 percent reporting fleets in "excellent" or "very good" condition, down from 47 percent. At the low end, 10 percent say their fleet is in "fair" or "poor" condition. Again, the larger fleets report above-average numbers: 61 percent say their fleet is in "excellent" or "very good" shape.
Contractors grew their workforce last year. Although half kept the same number of employees, 33 percent hired more workers and 16 percent decreased in size. Most of the gains were in hourly labor and in the larger fleets' hiring of skilled operators. Compared to the overall average, fleets larger than $10 million replacement value expanded their workforce at a much larger percentage than not, with a net of 46 percent on the expansion side.
Skilled labor does seem to be more available, however. The percentage of contractors reporting "no problem" in finding skilled workers has increased over the past three years. In 2000, 34 percent reported "no problem" in finding operators, 40 percent with mechanics, and 27 percent with other skilled labor. Last year, those percentages increased to 44 percent, 47 percent and 37 percent, respectively.


