It was a bad year for funding in the government sector last year, but not as dire as forecast. When asked in late 2002 what funding looked like for 2003, half of state fleets and one-third of local fleets expected funding to decrease. States bore up better than their local siblings: Funding fell for one-third of the state fleets, but local funding also fell for one-third, as forecast.
On a net basis (percent citing an increase minus that reporting a decrease), 20 percent of states saw funding decline and 14 percent of local government (city and county) fleets saw funding drop.
For this year, nets will creep up for both government groups, but there will still be significant funding shortfalls. Among states, the net forecast for funding decline is 16; for local it's 11. Regionally, Mountain, Pacific, Great Lakes and Northern Plains see nets off 25 and higher calling for declines in funding.
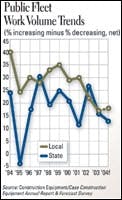
Work volume increased, even as funding fell, in 2003. Those volume increases weren't as steep as projected, but net increase for states was 16 v. 26 forecast; for local agencies it was 17 v. 19 forecast. Similar jumps have been forecast for this year: Net for states is 13, for locals 18. On an encouraging note, 57 percent of states and 65 percent of locals expect no change in current work volume.
Despite funding issues, volume growth forced fleets to expand, albeit not as aggressively as forecast. States really reined in their plans from a net projected increase of 23 to an actual of 15 in 2003. This year, 13 percent project expansion and 13 project retraction for a net growth of zero. Local fleet expanded a net of 11 last year and project 9 for 2004. Again, a large percentage (about three-fourths) of fleets expect to stay put with fleet levels.
Fleet-replacement rates, however, are projected to rebound this year after falling short of projections. States reported replacing only 7.5 percent of their fleets last year, and are looking to replace 8.2 percent in 2004. Local fleets replaced 6 percent, a historical low rate, and only look to replace 6.3 percent this year.
As expected, fleet condition suffered with replacement rates faltering and funding declining. In 2001, 53 percent of government fleets reported "excellent" or "good" when asked for their fleets' condition. Last year, that number was at 46 percent. State fleets are in especially weak shape, with only 35 percent in "excellent" or "good" shape. In fact, 23 percent say their fleets are in "fair" or "poor" shape.
The use of rental as an acquisition strategy increased among government fleets last year, to 59 percent from 54 percent. Twenty percent of state fleets and 17 percent of local fleets have increased their use of short-term rental in terms of total rental machine hours.
Popular machines rented by government agencies include light earthmoving, compaction, light equipment and heavy earthmoving.
One way government fleet managers can deal with flat or decreasing levels of funding is by reducing labor costs. Although 62 percent of all government respondents have kept staffing levels the same, 31 percent of states have decreased staff and 10 percent have increased for a net of 21 decreasing. Service and maintenance personnel were the hardest hit areas.
